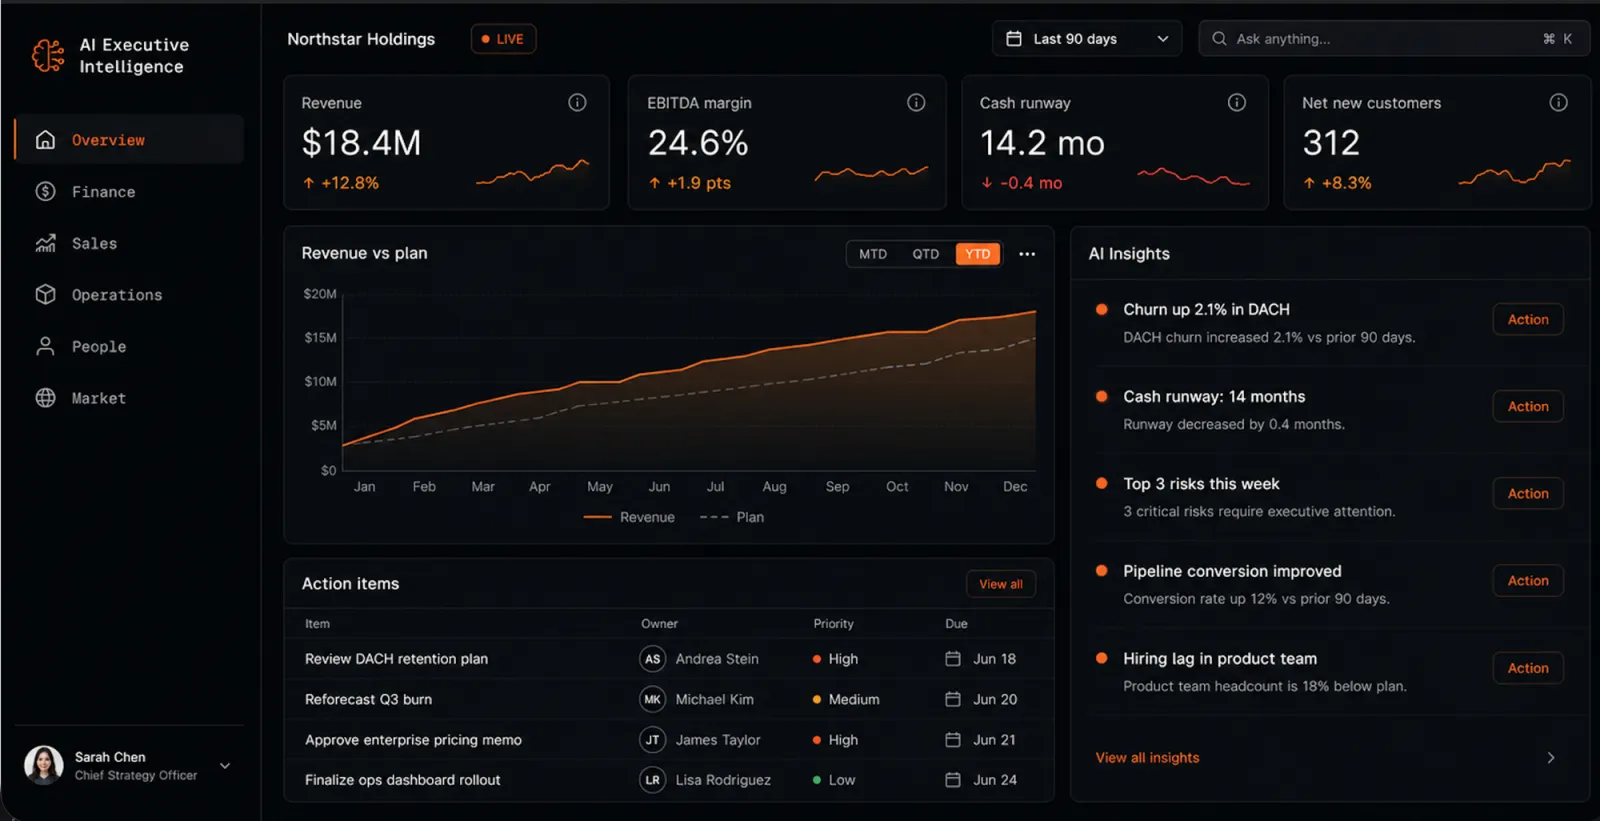
Your whole company. One screen. Powered by AI.
In 2026 every source — internal and external — flows into a single executive view. Clear insights, ready-to-act recommendations, and an AI assistant you can ask anything. Embedded in your organization, built by LANARS.
Every system you already run, finally read from one source of truth
Internal systems and outside markets feed a single governed data layer. Your executive team works from the same numbers, in the same moment — instead of reconciling seven exports the night before the board call.
Still assembling decisions from a dozen dashboards, spreadsheet exports and a Monday meeting? That's the old operating model.
Every tool added a screen, not an answer. By the time the numbers agree, the week is already gone — and so is the decision window.
A dozen tools, a dozen versions of the truth. Someone exports, someone reconciles, someone presents — and leadership still decides from a slide that was stale on send.
Every source, internal and external, converges into one executive view. Clear insights, ready-to-act recommendations, and an AI assistant you can ask anything — live, not last week.
A dozen dashboards nobody syncs
ERP, CRM, finance, ops and product analytics each tell a slightly different story. Reconciling them is a job, not an insight.
Spreadsheet exports, stale by Monday
Decisions ride on a CSV someone pulled on Thursday. By the time it reaches the board, the numbers have already moved.
Analysts building decks, not analysis
Your sharpest people spend the week formatting slides and chasing sources instead of answering the question that actually matters.
Decisions on gut, not on data
When the real number takes three days to assemble, leadership stops waiting for it. The call gets made on instinct — and the data only confirms it later.
Realistic ranges from real engagements
We won't pretend every rollout lands the same. These are the ranges executive teams typically see once the data pipes are clean and the questions are well-formed.
Seconds
Time-to-answer
Answers in seconds, not days
"What moved EBITDA this month and why" stops being a three-analyst project. You ask in plain language and get a sourced answer before the meeting starts.
1
Source of truth
One number everyone agrees on
Finance, sales and ops stop arriving with three versions of the same metric. Definitions live in one place, so the room argues about what to do, not whose number is right.
2-4x
Decision cadence
Decisions move faster
Monthly reviews become weekly. The bottleneck was never the meeting, it was the week of prep before it. Remove that and decisions compound instead of waiting in a queue.
3-9 mo
Payback period
Payback in one to three quarters
Most teams recover the build cost within three to nine months, from reclaimed analyst hours and decisions made before the window closed. Faster if reporting is already a known pain.
These are observed ranges from real engagements, not contractual guarantees. Your numbers depend on data quality, how decisions actually get made, and how messy the starting point is. We'd rather tell you that up front than oversell it.
From every source to one executive view, in four moves
No data-warehouse rebuild, no year-long programme. Four steps take you from disconnected systems to a live executive cockpit your leadership actually opens.
Connect every source
We wire in the internal systems you already run — ERP, CRM, finance, HR, ops — and external feeds like market, FX and competitor data. Every connector is secure, read-only OAuth, so nothing in your stack changes.
Unify into one model
Entity resolution and a single semantic layer turn departments that never reconciled into one source of truth. A customer, a cost centre, a quarter finally means the same thing everywhere.
AI reasoning layer
Continuous insight detection surfaces what moved and why, while an ask-anything assistant answers in plain language — with the exact numbers and where each one came from. No dashboard archaeology.
Live executive cockpit
The view lives where your leadership already works and updates continuously — embedded in your org. A decision surface that stays current, not a deck someone refreshes once a quarter.
The executive cockpit, and everything that runs inside it
Not another dashboard to check. A live operating view of the whole company, an AI that reads it for you, and a short list of things actually worth your attention this week.
- Live
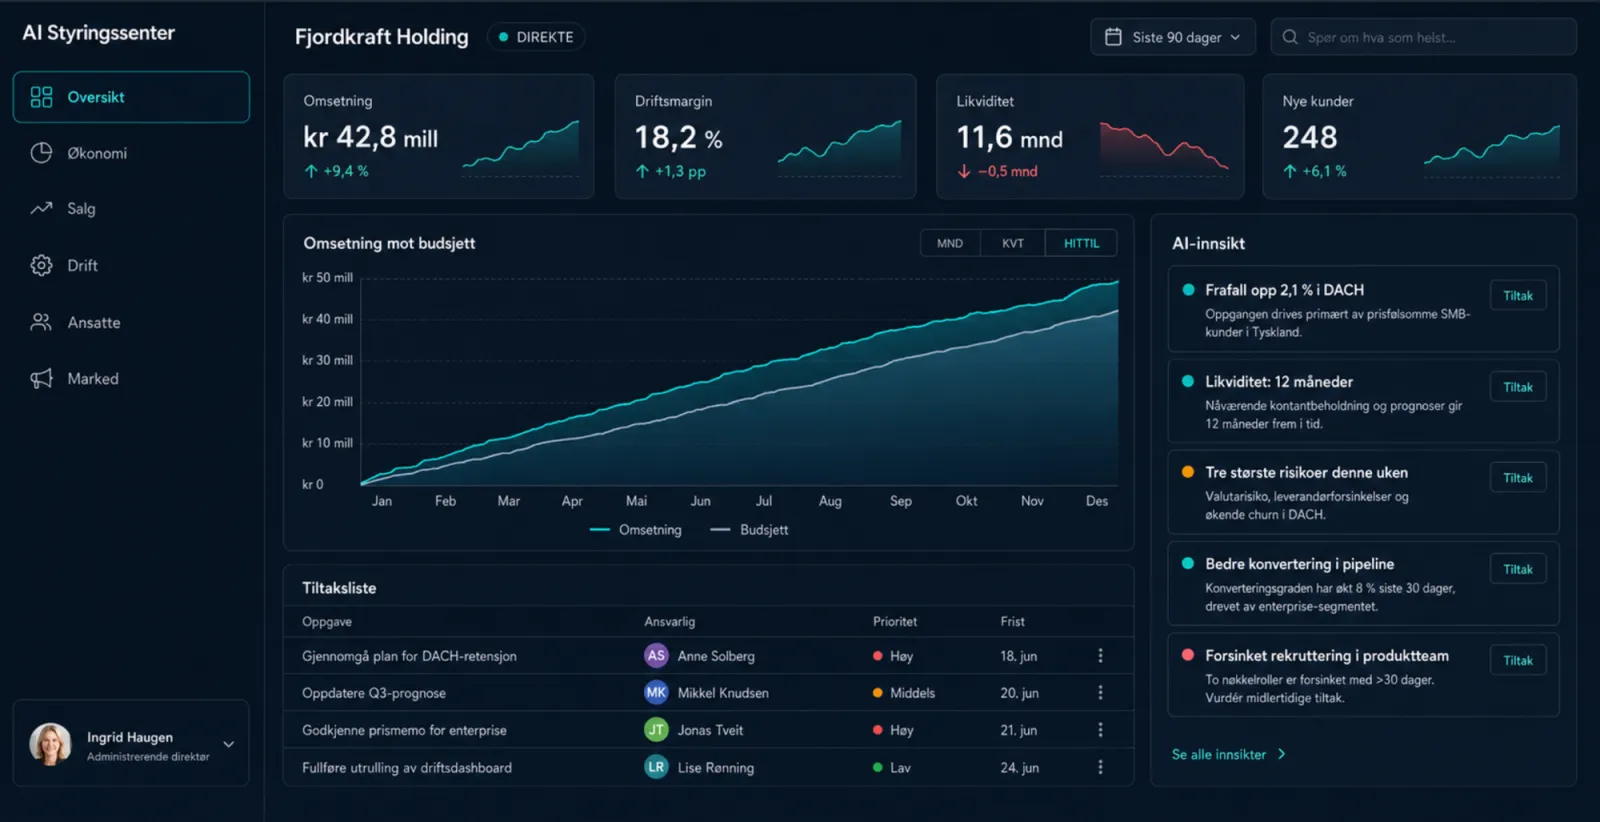
One executive cockpit
Every KPI you actually steer by, on one screen: revenue, margin, cash, pipeline, churn, delivery and headcount. Pulled live from your systems, reconciled to a single source of truth, drillable from board level down to the underlying record.
- Daily
AI insight feed
Instead of charts you have to interpret, you get the read: "Gross margin slipped 2.3pts in the Nordics, driven by FX and three discounted deals." Plain language, ranked by impact, with the numbers behind every claim one click away.
- Ask anything
Ask-anything AI assistant
Type a question in plain English and get an answer grounded in your own data: "Why did Q2 cash come in below plan?" or "Which accounts are at risk of churning next quarter?" It cites the sources, so you can trust and verify.
- With owners
Action items with owners
Every insight ends in a recommendation, not a shrug. Each one gets a suggested owner, a due date and the expected impact, and syncs to Jira, Asana or Slack so it lives where your team already works.
- Real-time
Anomaly alerts
The system watches the numbers so you don't have to. A spend spike, a margin drop, a stalled pipeline or a support backlog triggers an alert the moment it breaks pattern, with the likely cause already attached.
- Monthly
Monthly executive summary
A board-ready brief on the first of every month: what moved, why, what's at risk and what to decide next. Written by the AI from the same numbers your team trusts, ready to paste straight into the board deck.
Mobile access
The whole cockpit in your pocket. Check the morning read on the way in, ask the assistant a question from the airport, and approve an action item without opening a laptop.
One view, read three different ways.
The same unified data layer, framed for the person looking at it. CEO, CFO, COO — each opens the cockpit to the questions they actually have to answer.
- CEO
Run the whole company from one screen
The problem todayYou stitch the real picture together from a board deck, three dashboards and whatever the team remembered to flag. By the time it's assembled, it's last week's company.
What you get- A live executive cockpit across every function — revenue, cash, ops, people, product — instead of twelve tabs and a Monday recap.
- Plain-language insights that say what changed, why, and what to do — not just another chart that needs interpreting.
- Ask the assistant anything ("why did margin drop in March?") and get an answer traced back to the underlying systems.
- CFO
Close the gap between the numbers and the reasons
The problem todayFinance lives in exports. Reconciling ERP, billing, payroll and the bank into one trustworthy figure eats the first two weeks of every month — and external context like FX never makes it in.
What you get- One reconciled source of truth joining ERP, billing, payroll and bank with external market and FX data on top.
- Anomaly alerts on spend, cash and margin the day they move — not when the month-end pack lands.
- Board-ready summaries generated from live data, with every number drillable to the transaction behind it.
- COO
See operations the moment they drift
The problem todayOps signals are scattered across the support desk, the warehouse system, project tools and a dozen team spreadsheets. Problems surface in the standup, not in the data.
What you get- Cross-functional operational KPIs — throughput, SLAs, utilization, backlog — unified from every tool your teams already run.
- Action items with named owners pushed out of the cockpit, so an insight becomes a task instead of a note.
- Early-warning signals when delivery, capacity or quality start to slip, while there's still time to act.
The people behind the platform


Sources & integrations
It connects to the systems you already run the company on
Executive intelligence is only as good as the systems it reads from. We meet your stack where it is — finance, sales, people, support, product and the outside world — and turn it into one answer instead of seven dashboards.
ERP & Finance
The ledger of record. Revenue, margin, cash position and accruals pulled straight from the books — not from a slide someone made last quarter.
- SAP S/4HANA
- NetSuite
- Dynamics 365
- Tripletex
CRM & Sales
Pipeline, win rates and forecast — reconciled against what finance actually recognised, so the number in the board pack matches the number in the bank.
- Salesforce
- HubSpot
- Pipedrive
- Close
HR & People
Headcount, attrition, hiring velocity and fully-loaded cost per team — the inputs behind every plan that depends on people you do or don’t have.
- Workday
- BambooHR
- Personio
- HiBob
Ops & Support
Ticket volume, SLA breaches, incident load and time-to-resolution — the early warning system that moves before churn shows up in revenue.
- Zendesk
- Intercom
- Jira Service Management
- PagerDuty
Product analytics
Activation, retention cohorts and feature adoption joined to the warehouse, so usage and money sit in the same sentence.
- Amplitude
- Mixpanel
- Snowflake
- BigQuery
External feeds
Registry data, FX rates, market signals and payment flows — the context that turns an internal number into a defensible decision.
- Brønnøysund Register
- ECB FX rates
- Bloomberg
- Stripe
+ Custom & legacy
Got a homegrown system, a database nobody documented or a vendor with a hostile API? We build the connector. Whatever you run, we either migrate off them or integrate with them — your call, not the tool’s.
Built for the C-suite
One executive view your leadership team actually reads, every morning.
- CEO
- CFO
- COO
- CMO
- CIO
No required migration, no rip-and-replace — we read your systems as they are today and tighten the connection as you go.
Tune the cadence, the depth, and where it runs
Same cockpit, configured to how your leadership actually decides. Real-time or a Monday briefing. Executive or technical depth. In the cockpit, Slack, email or a board PDF. On our infrastructure or yours.
- Cadence
How often it refreshes
From live KPIs on the floor to a single briefing waiting before the board meeting.
- Real-time
- Daily
- Weekly
- Depth
How deep each view goes
Same numbers, three altitudes — so the CEO and the analyst each read the truth that fits them.
- Executive
- Operational
- Technical
- Delivery
Where insights reach you
The cockpit is home base; the rest meets your team where they already work.
- Cockpit
- Slack / Teams
- Board PDF
- Hosting
Where your data lives
Built for finance and health: SSO, role-based access, audit logs and a signed DPA, in an EU region — whichever side it runs on.
- Our infrastructure
- Your cloud / VPC
- EU region
Not sure which mix fits? We start from how your leadership actually makes decisions and configure backwards from there — and for regulated buyers in finance or health, we deploy inside your own perimeter so source data never leaves it.
See Our Expertise Through Real Projects


Defigo
Smart doorbell
A smart doorbell and access management platform that connects residents, property managers, and visitors through seamless digital keys, video calling, and automated entry workflows — all managed from a single mobile app.


Byzans
A social network for passionate readers
A vibrant reading community where book lovers discover new titles, build personal libraries, join book clubs, and share reviews. Readers connect with others who share their literary taste through curated recommendations and live discussions.


MIA
Digital health platform
A digital health platform that empowers users to track symptoms, monitor wellbeing, and access personalised health insights — connecting people with expert guidance and the tools they need to take control of their health journey.
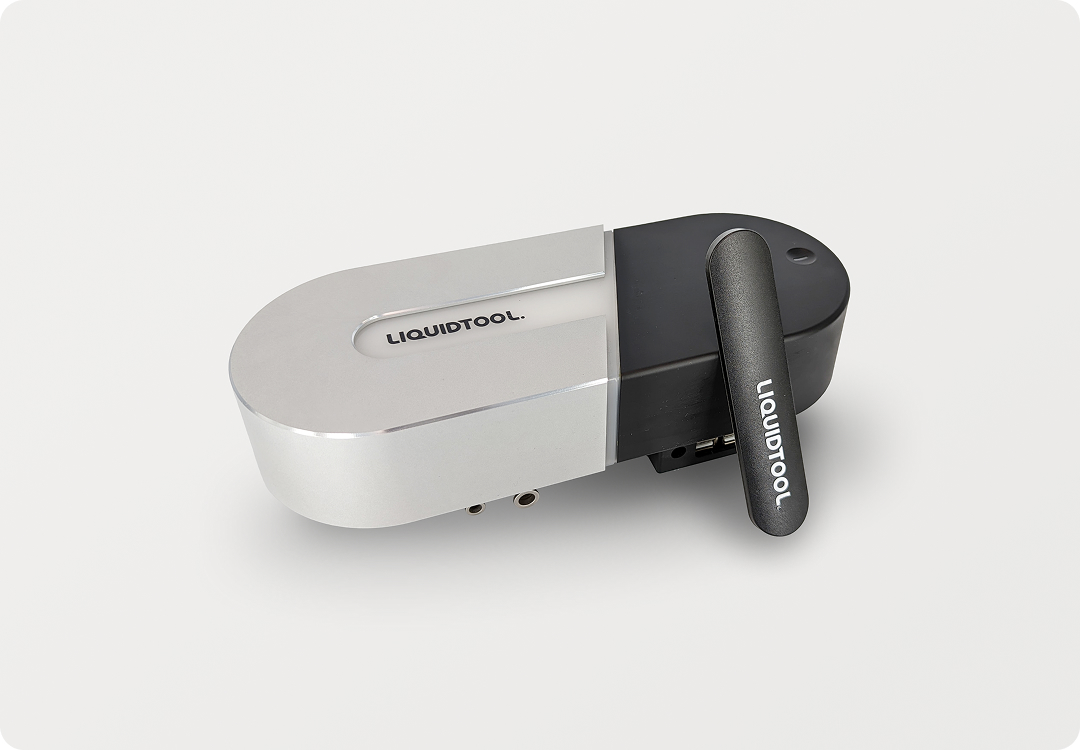


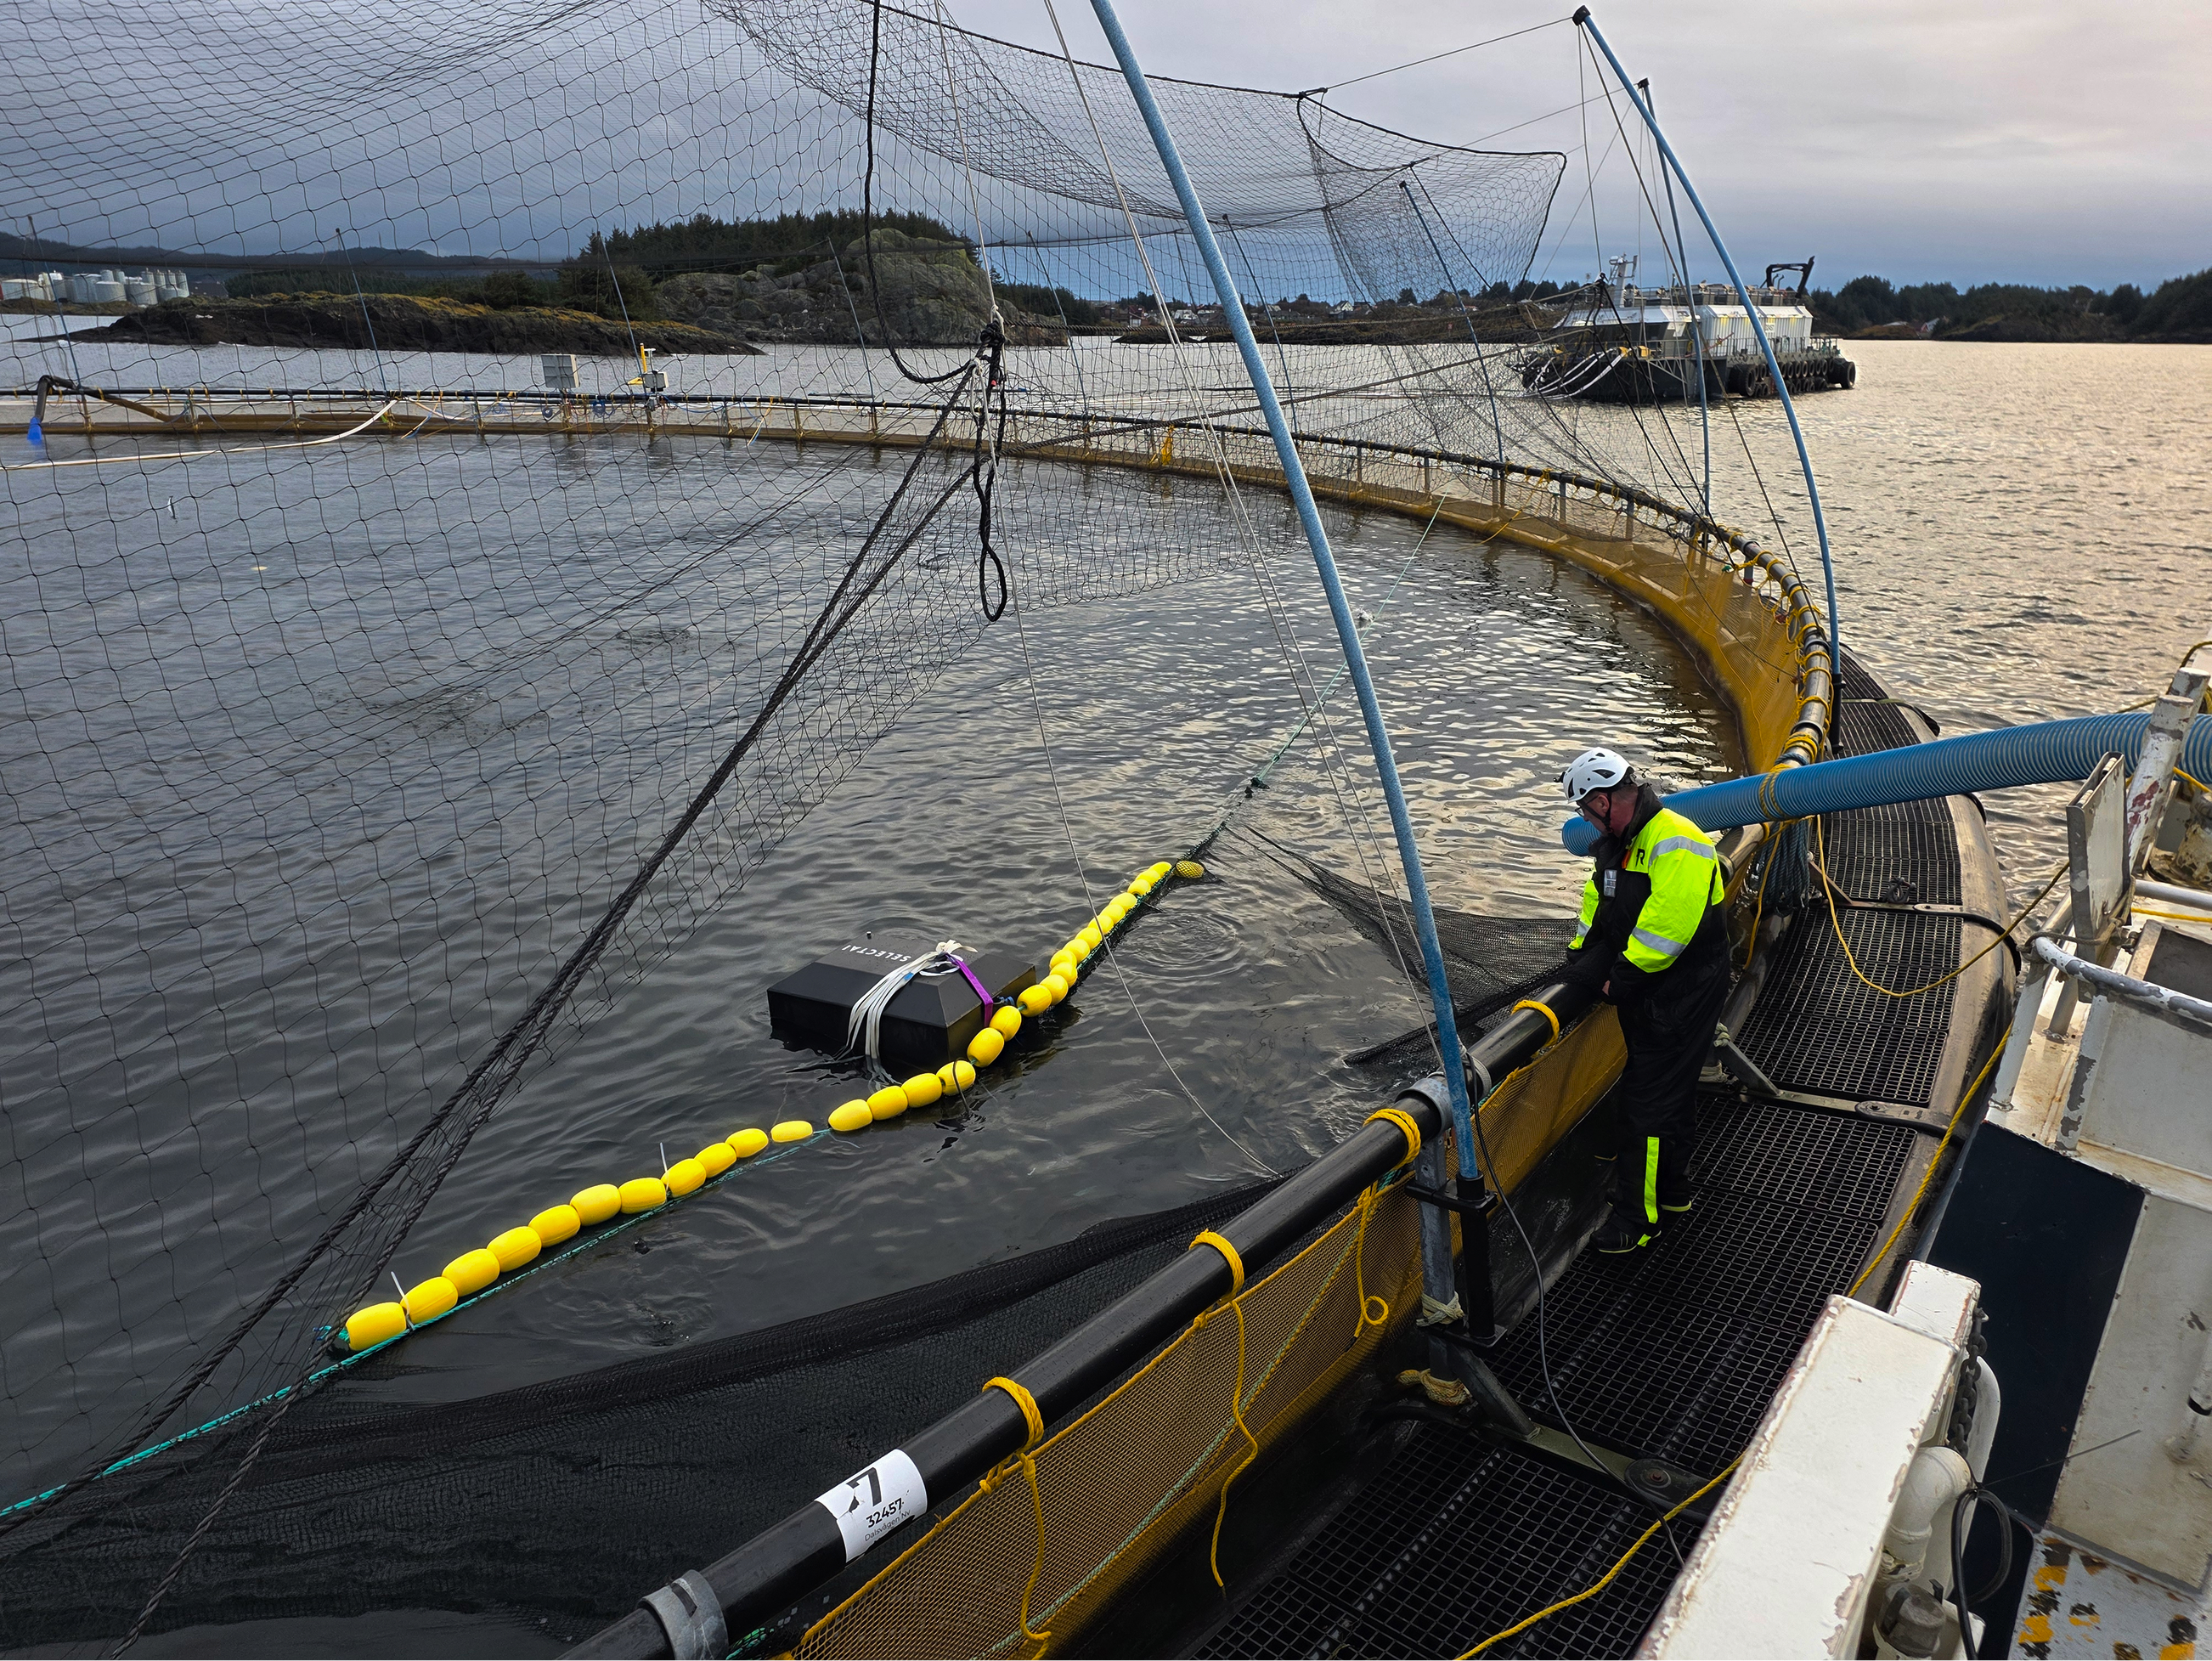
Liquid Tool
A remote smart coolant automation system
A remote smart coolant monitoring system that tracks fluid levels, temperature, and contamination across industrial machines in real time — enabling predictive maintenance, reducing downtime, and cutting operational costs significantly.


More projects
Explore 30+ case studies
Questions, answered
Frequently asked questions we get by executives

Get started with Lanars

Tell us about your project. We respond to every inquiry within one business day. Really!